Many people feel that a National Broadband Network is a recent, poorly thought through and unnecessary initiative. The reality is that the Australian Government has had a litany of national broadband plans over the last 12 years. Failed tenders occurred in 2003 (Government – Liberal), 2005 (Private – Telstra), 2006 (Private Optus/Elders + Government – Liberal), 2007 (Government – Labor) before finally in 2009 Labor founded NBNCo to build a Fibre to the Premises (FTTP) network. The demand and planning has evolved exponentially over this time period.
The question therefore is (and has been for 12 years) not if we need a National Broadband Network, but which method is the best? Side by side, you can see that the original NBN plan went through a number of revisions over the years, and also see it presented alongside the new MTM plan produced by the current Australian Government:
|
2012-15 |
2013-16 (v12) |
2013-16 (v13)(Last NBN revision) |
2014-17(First MTM plan, post 2013 election) |
| Revenues to CY2021 |
AU$23.1b |
AU$21.7b |
AU$19.4b |
AU$18b |
| Total capital expenditure |
AU$37.4b |
AU$37.4b |
AU$37.4b |
AU$30b |
| Total premises covered |
13.176m |
13.176m |
13.274m |
Not specified |
| Total premises activated |
8.286m |
8.757m |
8.788m |
Not specified |
| Opex to CY2021 |
AU$26.4b |
AU$26.4b |
AU$26.9b |
AU$27b |
| Funding: Government equity |
AU$30.4b |
AU$30.4b |
AU$30.4b |
AU$29.5b |
| Funding: Debt |
AU$13.7b |
AU$15.2b |
AU$13.8b |
AU$12b |
| IRR |
7.1% |
7.1% |
7.1% |
3.2%-5.4% |
| Rollout method |
FttP |
Build drop FttP (NBN 2.0) |
Build drop FttP (NBN 2.1) |
MTM |
| Total premises passed by end FY2015 |
3.664m |
3.202m |
2.507m |
1.093m |
| Average Download Speed |
100Mbps |
100Mbps |
100Mbps |
46Mbps |
From ZDNet
Overall the maths and tradeoff is fairly clear, a 20% reduction in cost (capex reduction of $7.4b) results in a 54% reduction in speed. Of course given the current economic pressures this can be seen as a necessary evil, despite the significant deterioration in cost benefit.
There are two hidden factors that make this seemingly simple tradeoff more painful:
1) Copper produces incredible variations in connection speed
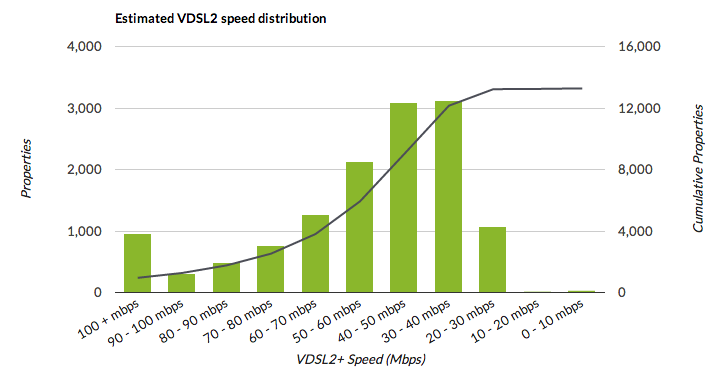
MTM speed estimates for Woy Woy, NSW
Full transparency, I work for YouTube. We are a service that is greatly affected by variable connection speeds, but we are not alone: Netflix, Pandora, Spotify, Quickflix etc. are all impacted. When someone like Netflix or Apple looks to bring a service to Australia, consistency of service delivery is an absolute requirement. It took Netflix 7 years before they would launch in Australia. If Netflix can’t justify launching in Australia, how can a start-up every achieve scale within the already small pool of Australian connections? It’s not possible, and moving overseas quickly becomes the obvious solution. To the right is a graph of what connection speeds will look like in one of the cherry picked MTM trial sites in Woy Woy, NSW. This doesn’t even take into account variations in speed due to weather, something copper is prone to. The fibre NBN on the other hand delivers almost uniform consistency across the country at all times.
2) Copper costs $1b a year to maintain (as of 2014, the government’s problem)
Copper lines are a very expensive asset that is rapidly declining in value. In the original NBN deal the copper was not included, instead NBN only got access to ducts and would pay Telstra as lines were decommissioned – a way to link pit remediation to Telstra’s financial incentives. Under the new MTM deal with Telstra signed in December 2014 there was almost no change, except that the copper was given by Telstra to the Government for $0 extra. Of course the devil in the detail is that the copper network currently comes with a $1b annual maintenance bill. If the government now needs to take over this maintenance bill, and rework the entire Telstra HFC network, who could they turn to for help? Of course Telstra will win the majority of this contract, they know the infrastructure better than anyone and are already winning 50% of the new contracts the NBN is handing out post-deal. That’s why I bought shares in Telstra.
So in conclusion, what’s the real trade-off?
The $7.4b capex reduction from the MTM to 2021 is neatly replaced by 7 years worth of copper maintenance at $1b a year. Even if it’s slightly less then $1b, the overall benefit at 2021 will be less than $1b in savings for a 54% decline in speed.
This also completely ignores the facts that the NBN fibre network will have lower ongoing maintenance costs, power costs, has near complete speed uniformity across the network, delivers a 2%+ higher IRR for the government and will be upgraded to 10x (1000Mbps) speed for absolute minimum cost.
Unfortunately in modern politics is seems anything beyond a 4 year term is irrelevant to the debate, and instead the focus is on what can be delivered as cheaply as possible before the next election on or before Jan 2017. That’s about the only time in history where the MTM will look even marginally better.