Software runs my life

Tag: nsw

Mortgage Stress

How much of your income goes to pay the mortgage?
It is not hard to find doomsday predictions for the Real Estate market. Sites such as Who Crashed the Economy are a collation of tales of pending economic (and particularly housing sector) destruction. There is a trend that indicates mortgage stress and housing price falls are limited to the outer suburbs of Sydney, primarily the west and south-west. Even when you analyse mortgage stress on a nationwide basis these suburbs keep appearing.

So I guess the question is whether this effect will be seen in the more blue label, inner-city suburbs. Most experts seem to think that the next 9 months or so are a good time to buy; if you have some savings tucked away and can ride out high interest rates in the short term. The next official inflation reading comes out on July 23, so a change in rates after this time is entirely possible. Whether the increases end there, or another ones comes in November, is anyones guess. I will be watching these news stories pretty closely, as it seems most of Australia is.

I was prepared to bid at an auction on the weekend, but it sold for $100k (15%) more than the quoted price range, and $50k less than what turned out to be the vendor’s target selling price! Clearly there is still a lot of dodgy underquoting practices from certain agents and turbulent pricing changes are still shaking themselves out in this market. I just have to hang in there and hope (as evil as it is) that a foreclosure can deliver me a reasonably priced dream home.

First Home Buyers Grant

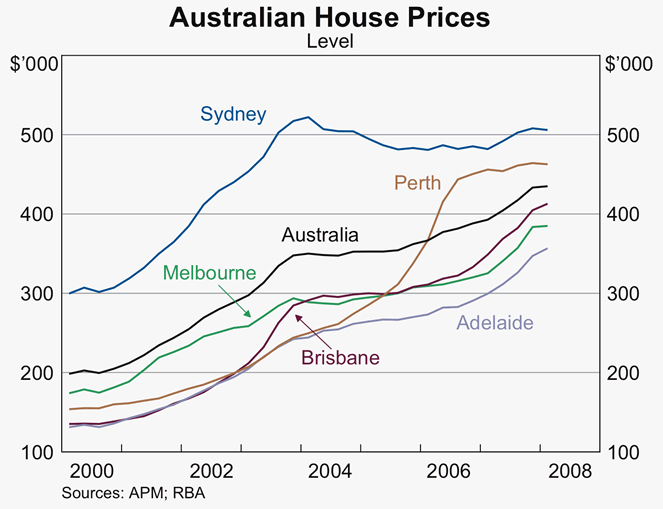
The NSW Government introduced the First Home Buyer’s Grant Scheme back in the year 2000. The $7000 cash bonus is nice, but it is the stamp duty concession that really helps out. The stamp duty calculator shows that the duty on a $500k home drops from $18,170 to a tiny $180 if you are a first home buyer, a huge saving of $17,990. This saving deteriorates pro-rata however as the price of the home approaches $600k, at which point it becomes unavailable. Means testing by this method is all well and good, as long as the means test is indexed. Back in 2000 property prices were significantly lower than they are today, as shown by the Reserve Bank’s own property price index graph from the May 2008 Regional Economic Performance Report:

Graph of Australian House Prices 2000 to 2008

This graph clearly shows that property prices have at least doubled in every state in the last 8 years, the same time period the grant scheme has been running. For 8 years of rapid growth the threshold has remained unchanged. NSW is actually the worst state for this, with an Age article citing:

Mortgage repayments account for 29.1% of total first home-buyer income, a one percentage point increase over the December (2007) quarter.

Adding to the cost of housing are taxes and charges, which added $110,000-$115,000 to the typical house and land package in Sydney, Mr Lamont said. In Victoria, that figure is about $57,000.

Surely the NSW Government should be keeping more of a finger on the pulse rather than making huge profits from Stamp Duty. The Federal Government is a little closer with their savings accounts, but $5000 a year is not going to get you a decent deposit anytime soon.

Powered by WordPress & Theme by Anders Norén